Infographics
According to Google Trends, there are 62 million results for the search term “infographic” as of April 2015. That’s a lot of info, and a lot of graphics. It makes sense: Color images increase willingness to read by 80 percent, and 90 percent of information transmitted to the brain is visual.
|
|
|
|
|
|
You can download a PDF sample of any of the above infographics below.
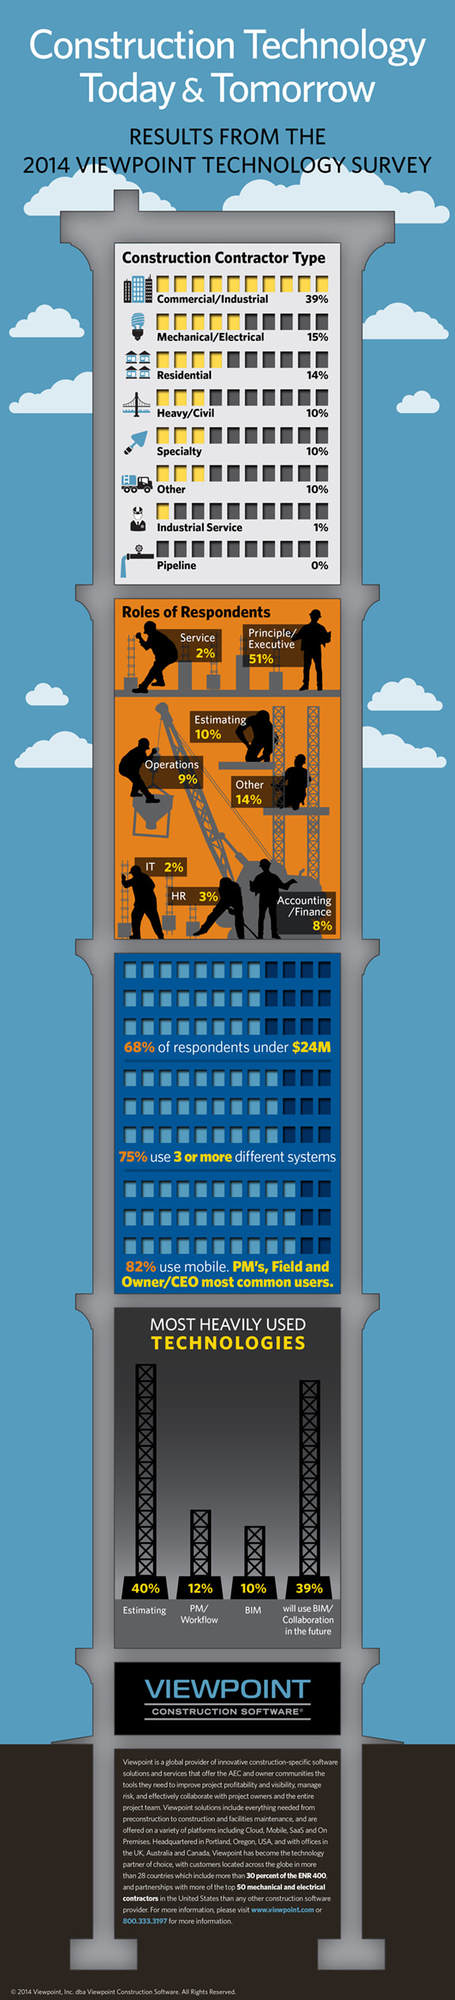
To download the Construction Technology Today & Tomorrow Industry Survey Results infographic click here.
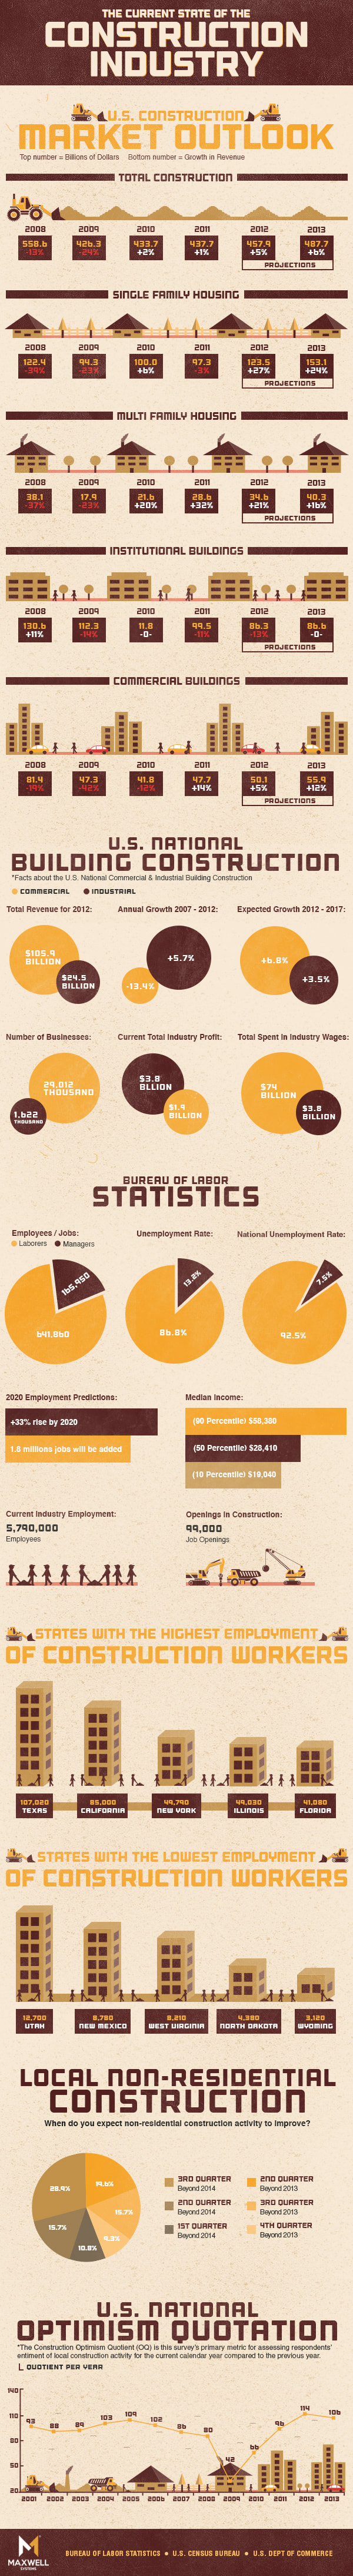
To download the Construction Industry Market Forecast infographic click here.
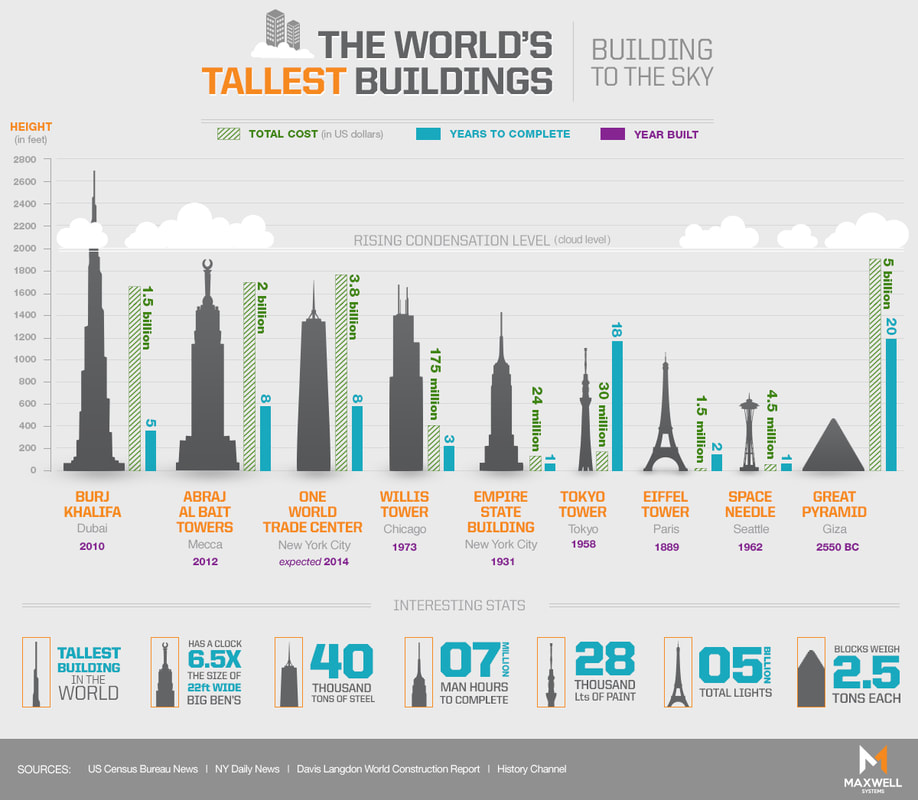
To download the World's Tallest Buildings infographic click here.
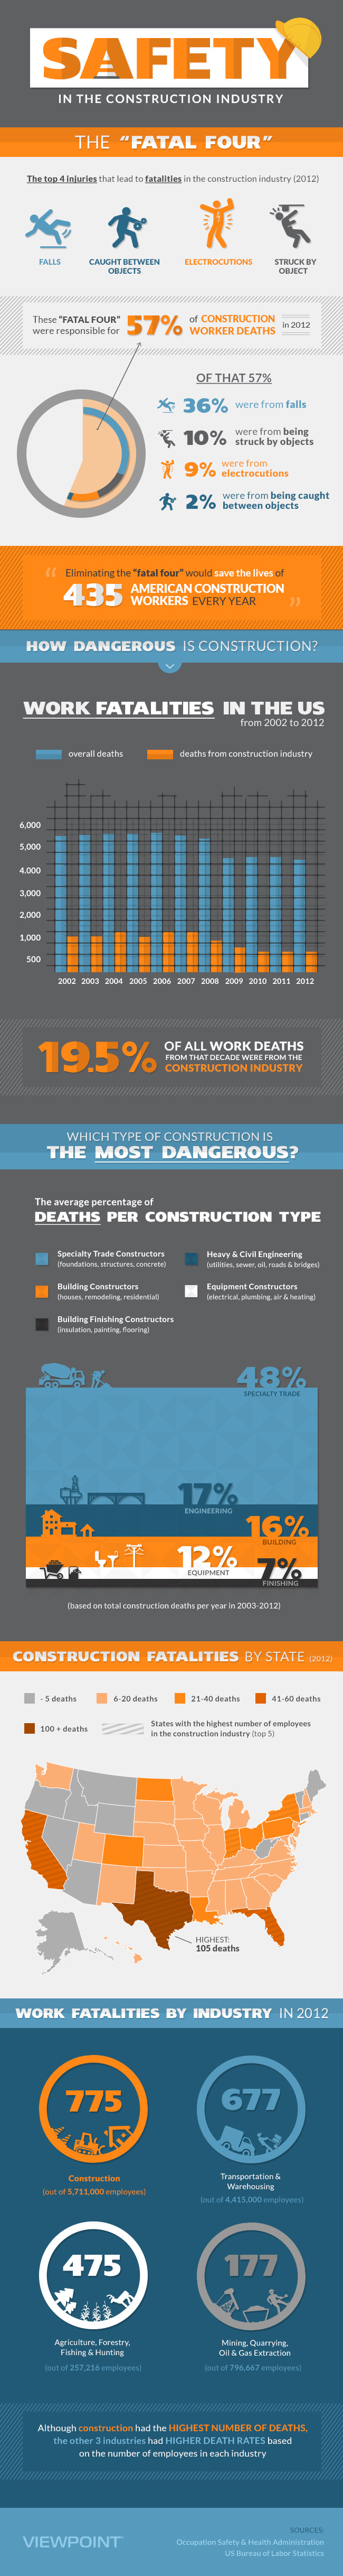
To download the Construction Safety Statistics infographic click here.
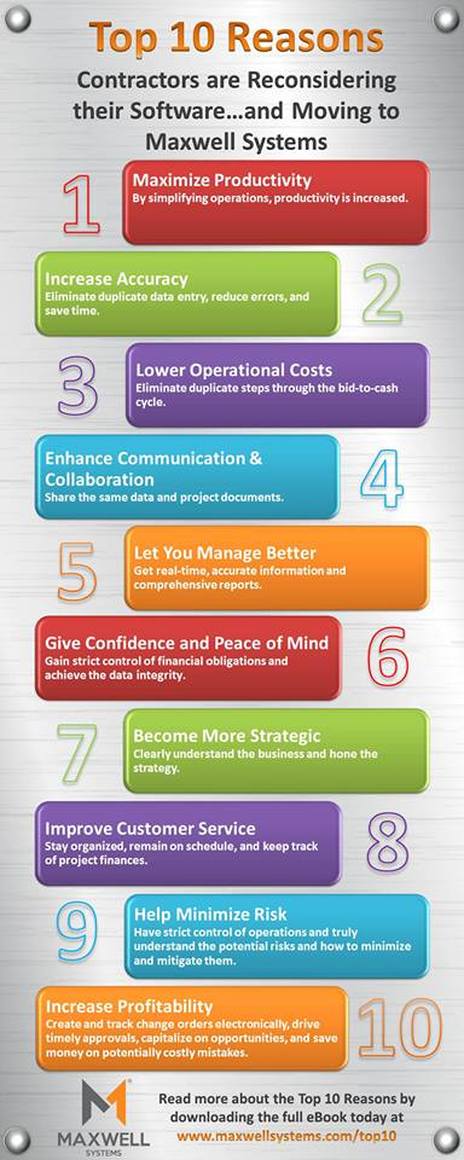
To download the Top Ten Reasons infographic click here.
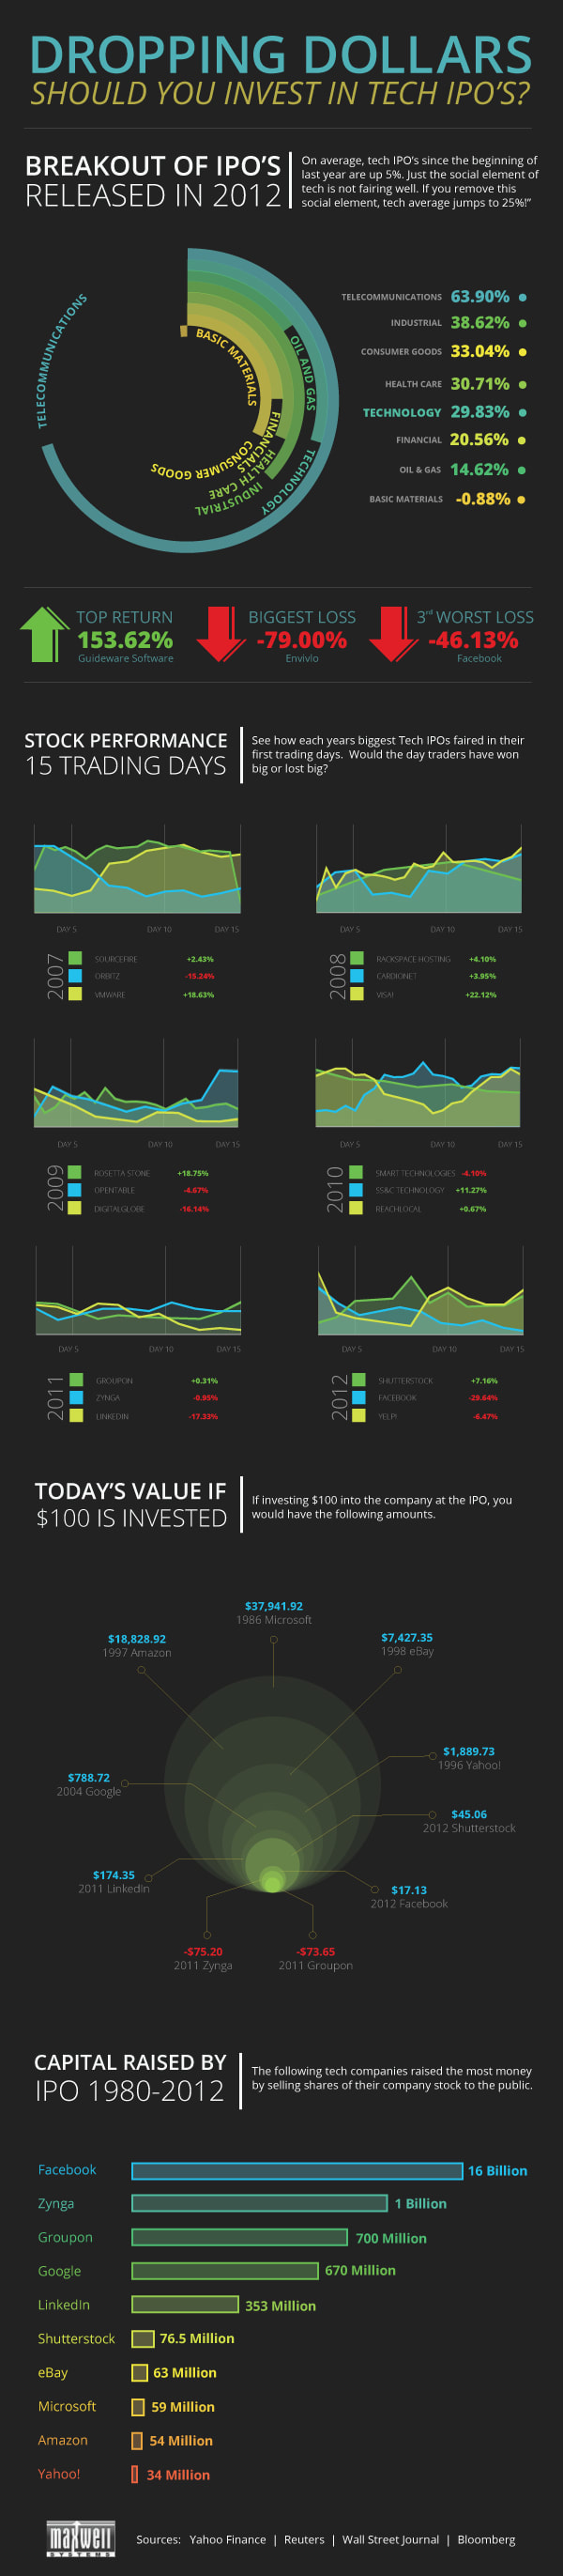
To download the Technology IPO Investment infographic click here.
To download the Construction Technology Today & Tomorrow Industry Survey Results infographic click here.
To download the Construction Industry Market Forecast infographic click here.
To download the World's Tallest Buildings infographic click here.
To download the Construction Safety Statistics infographic click here.
To download the Top Ten Reasons infographic click here.
To download the Technology IPO Investment infographic click here.